Maximo Activity Dashboard (PerfMon)
Maximo PerfMon is a diagnostic tool that tracks server-side performance by capturing request times, SQL execution details, and MBO activity. It is enabled through a simple change in the web.xml file followed by redeploying the Maximo EAR. Once activated, its dashboard can be accessed via PerfMon.jsp, though it should be used only briefly because it impacts system performance.
Ankit Chaudhary
11/27/20252 min read
Understanding the Maximo Activity Dashboard (PerfMon): A Practical Guide
When working with IBM Maximo, performance issues can occasionally disrupt smooth operations—especially in large or heavily customized environments. To troubleshoot such bottlenecks, Maximo provides a built-in tool known as the Maximo Activity Dashboard, commonly referred to as PerfMon.
Introduced in Maximo 7, PerfMon offers deep insights into server-side processing and is invaluable for diagnosing slow UI interactions, heavy SQL queries, or inefficient MBO behavior. This guide explains what PerfMon is, how to enable it, and how to use it effectively.
What is PerfMon?
The Maximo Activity Dashboard (PerfMon) is a server-side performance monitoring interface designed to help administrators and developers debug performance-related issues.
Once enabled, it provides detailed data on each request sent from the UI to the Maximo server.
Key Capabilities of PerfMon
PerfMon captures performance metrics at multiple levels, including:
1. Server-Side Request Processing
Total response time for each user action
Average response time for similar request types
The navigation event or UI action that triggered the request
2. MBO (Maximo Business Object) Execution Details
Total number of SQL statements executed
How often each SQL was run
Actual execution time for each SQL
Number of SQL statements exceeding 100 ms
Total MBOs generated during the request
3. Oracle-Specific Benefits
If Maximo is using an Oracle database, PerfMon can also display Explain Plans for executed SQL, making it easier to identify full table scans or inefficient access paths.
Important Warning
Do NOT leave PerfMon enabled on a production server longer than necessary.
PerfMon introduces overhead that can significantly degrade performance.
Only enable it temporarily for diagnostics
How to Enable PerfMon in Maximo
Enabling PerfMon is straightforward and involves modifying the web.xml file.
Step 1: Locate the web.xml File
Navigate to:
<maximo install folder>\<EAR>\maximouiweb\WEB-INF\web.xml
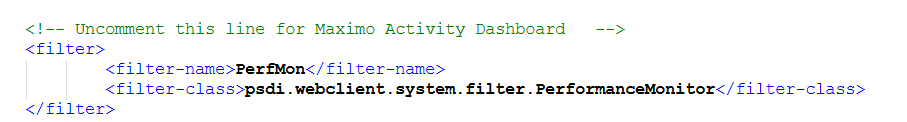
Step 2: Add or Uncomment the PerfMon Filter
Insert (or uncomment) the following code:
Filter Definition
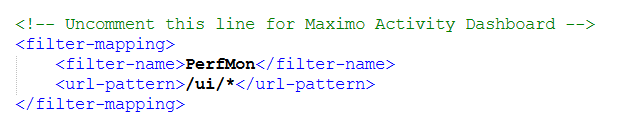
Filter Mapping
Step 3: Rebuild & Redeploy the Maximo EAR
Follow your standard procedure for:
Rebuilding the Maximo EAR (maximo.ear)
Redeploying it to WebSphere / WebLogic
A full application server restart is required for the changes to take effect.
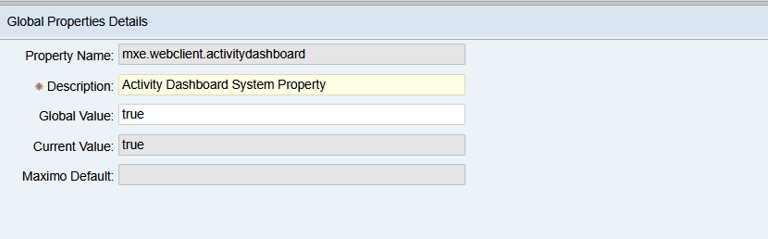
Step 4: Create a System Property in Maximo
When set to true you will be able to capture logs on Activity Dashboard.
When set to false you will not be able to capture logs on Activity Dashboard.
Step 5: Open the PerfMon Dashboard in a Separate Browser Tab
http://<hostname>:<port>/maximo/webclient/utility/profiler/PerfMon.jsp
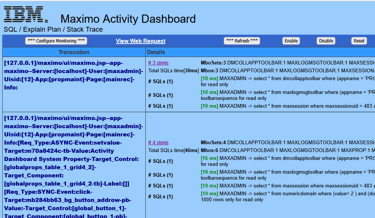
What You’ll See
The dashboard displays:
A list of server requests
Response times
Clickable details for each request
Selecting “View Server Request” will show deeper insights such as:
SQL execution time
MBO counts
Stack traces
Slow SQL calls
Navigation history associated with each request
This makes it much easier to pinpoint slow screens, inefficient queries, or custom code issues.